PDE model with multi domains
Download Im2mesh package https://www.mathworks.com/matlabcentral/fileexchange/71772
Im2mesh package require Matlab Mapping toolbox
Before we start, please set folder "Im2mesh_Matlab" as your current folder of MATLAB.
clearvars
Function bounds2mesh use a mesh generator called MESH2D (developed by Darren Engwirda). We can use the following command to add the folder 'mesh2d-master' to the path of MATLAB.
addpath(genpath('mesh2d-master'))
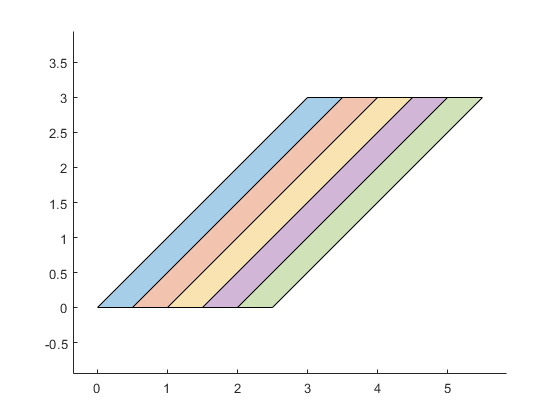
create polyshape
% Height and width of polygons
size_x = 0.5;
size_y = 3;

% Number of polygons
Npoly = 5;
psCell = cell( Npoly, 1 );

for i = 1:Npoly
    % Getting coordinates of current polygon's points
    p1_x(i) = (i-1)*size_x;
    p1_y(i) = 0;
    p2_x(i) = size_y + (i-1)*size_x;
    p2_y(i) = size_y;
    p3_x(i) = size_y + size_x + (i-1)*size_x;
    p3_y(i) = size_y;
    p4_x(i) = size_x + (i-1)*size_x;
    p4_y(i) = 0;
    points = [p1_x(i),p1_y(i); p2_x(i),p2_y(i); p3_x(i),p3_y(i); p4_x(i),p4_y(i)];

    pg = polyshape(points(:,1),points(:,2));
    psCell{i} = pg;
end
plot
figure;
hold on; axis equal;
for i = 1: length(psCell)
    plot(psCell{i})
end

hold off
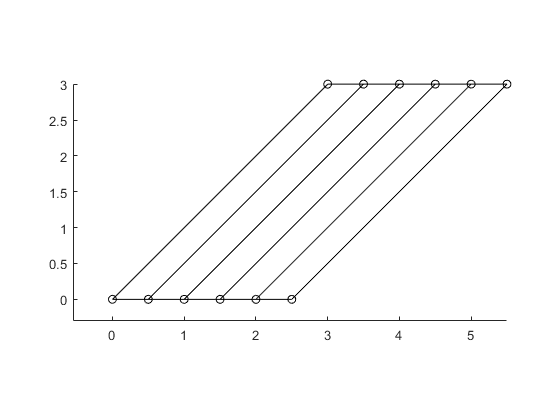
Convert to a nested cell array of polygons
bounds = polyshape2bound(psCell);
tol_intersect = 1e-6;
bounds = addIntersectPnts( bounds, tol_intersect );

% plot boundaries and show all vertices
plotBounds(bounds,false,'ko-')
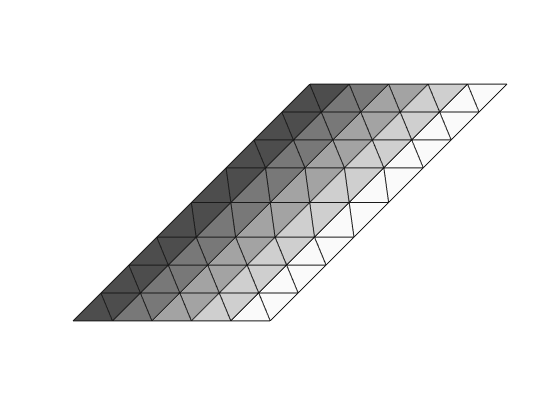
Generate mesh
hmax = 0.5;
grad_limit = 0.25;
opt = [];
opt.disp = inf; % silence verbosity
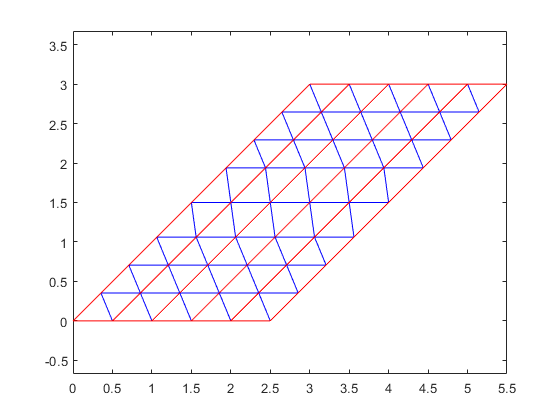
[vert,tria,tnum,vert2,tria2] = bounds2mesh( bounds, hmax, grad_limit, opt );
plotMeshes(vert,tria,tnum);
Create matlab pde model object
% linear model
model_linear = createpde();
geometryFromMesh( model_linear, vert', tria', tnum' );

% qudratic model
model_quad = createpde();
geometryFromMesh( model_quad, vert2', tria2', tnum' );
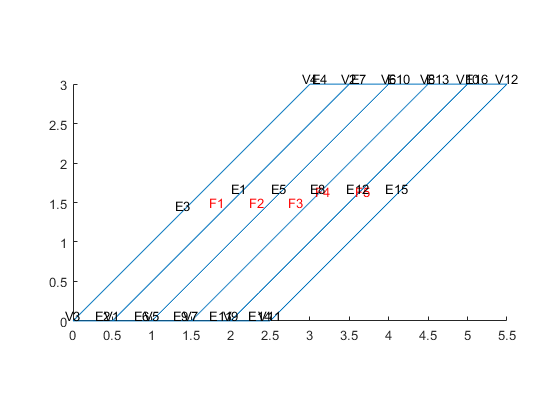
show geometry
pdegplot(model_quad, 'EdgeLabels','on','VertexLabels','on', 'FaceLabels','on' )
Show mesh
pdemesh( model_quad )
end