Generate mesh based on 2D contours
For finite element analysis
Contents
Download Im2mesh package https://www.mathworks.com/matlabcentral/fileexchange/71772
Im2mesh package require Matlab Mapping toolbox
Before we start, please set folder "Im2mesh_Matlab" as your current folder of MATLAB.
Function bounds2mesh use a mesh generator called MESH2D (developed by Darren Engwirda). We can use the following command to add the folder 'mesh2d-master' to the path of MATLAB.
addpath(genpath('mesh2d-master'))
clear all
Example 1
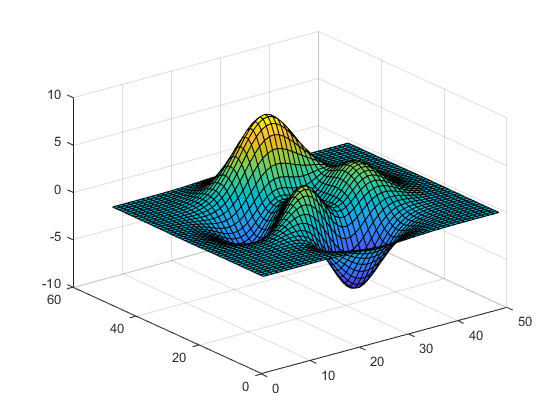
Define Z, interested level, and outer boundary
Z = peaks;      % Z is a 49-by-49 matrix containing the height values of
                % the surface with respect to the x-y plane.

level = 1.5;    % interested level

% outer boundary
xmin = 0;
xmax = 50;
ymin = 5;
ymax = 55;
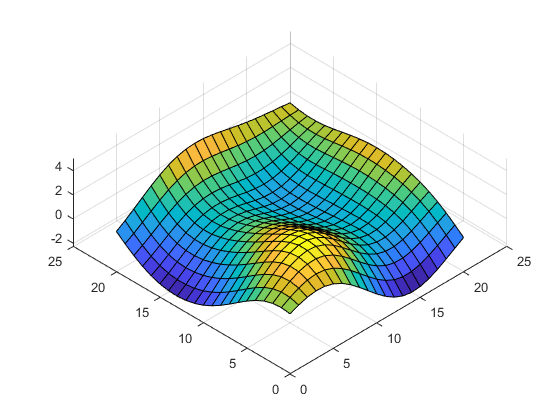
Plot surface
surf(Z)
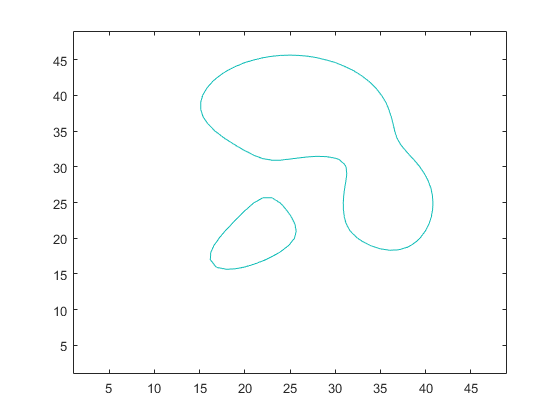
Plot contour
contour(Z, [level,level]);
Store vertices in countour
C = contourc(Z, [level,level]);

contourCell = {};   % a cell array for vertices in countours
k = 1;              % current column in C

while k < size(C,2)
    nv = C(2,k);           % number of vertices
    idx  = k+1 : k+nv;     % columns that hold the vertices
    xy = C(1:2,idx)';      % nv-by-2 array
    contourCell{end+1} = xy;

    k = k + nv + 1;       % jump to next header
end
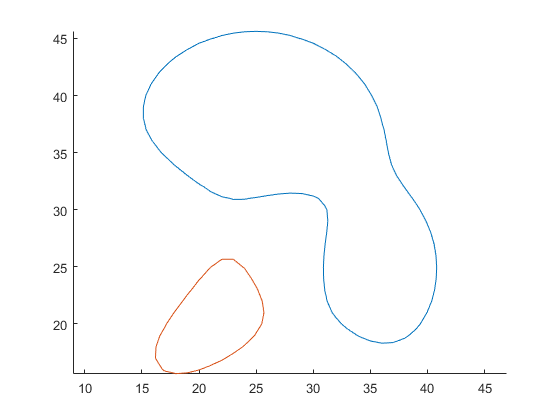
Plot contourCell
figure
hold on; axis equal
for i = 1: length(contourCell)
    plot( contourCell{i}(:,1), contourCell{i}(:,2) )
end
hold off
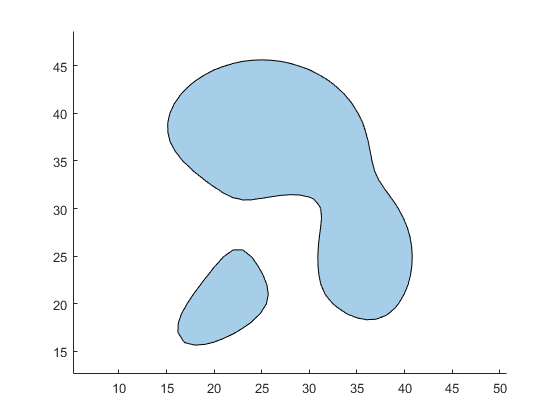
Convert contourCell to polyshape object
x_temp = [];
y_temp = [];

for i = 1: length(contourCell)
    x_temp = [ x_temp; NaN; contourCell{i}(:,1) ];
    y_temp = [ y_temp; NaN; contourCell{i}(:,2) ];
end

psIn = polyshape( x_temp, y_temp  );
Plot polyshape object
plot(psIn);
axis equal
create polyshape for outer boundary
vertex = [xmin ymin; xmax ymin; xmax ymax; xmin ymax; xmin ymin];
psOB = polyshape(vertex);   % polyshape for outer boundary
Boolean operation
psOB = subtract(psOB, psIn);
plot
figure
hold on; axis equal
plot(psOB);
plot(psIn);
hold off
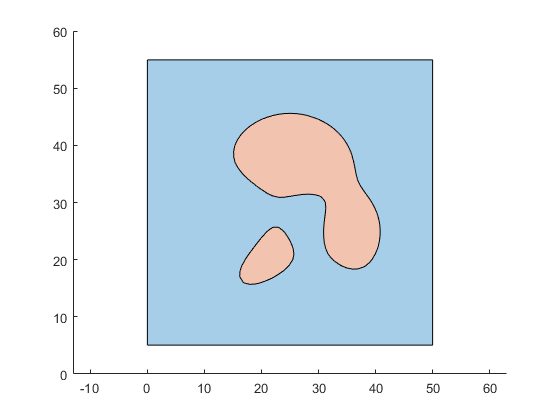
Convert to a nested cell array of polygons
psCell = {psOB; psIn}; % a cell array of polyshape
bounds = polyshape2bound(psCell); % a nested cell array of polygons
tol_intersect = 1e-6;
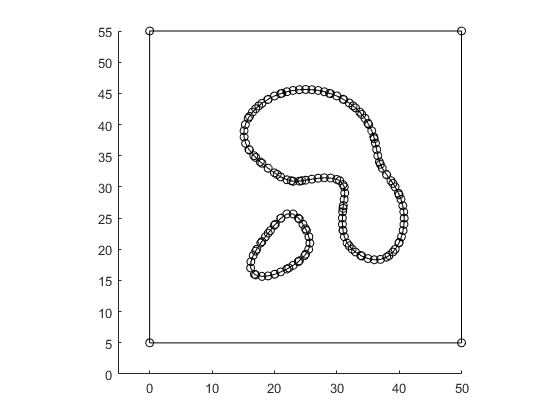
bounds = addIntersectPnts( bounds, tol_intersect );
% plot polygons and show all vertices
plotBounds(bounds,false,'ko-')
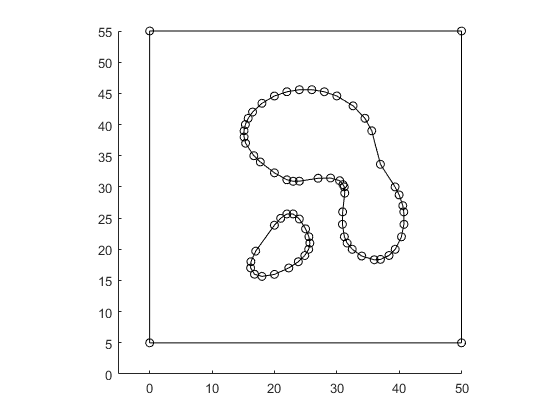
Reduce the number of vertices
boundsNew = getCtrlPnts( bounds, false );

tolerance = 0.1;   % For polyline simplification
                   % This value will affect the final mesh size.
                   % Increase tolerance, the min mesh size will increase.
boundsNew = simplifyBounds( boundsNew, tolerance );

% show all vertices
plotBounds(boundsNew,false,'ko-')
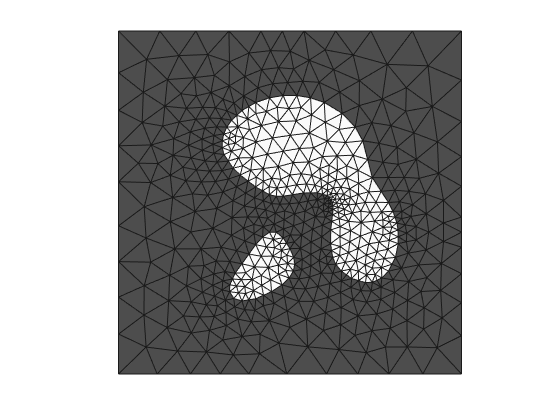
Generate mesh
hmax = 500;
grad_limit = 0.25;
opt = [];
opt.disp = inf; % silence verbosity
[vert,tria,tnum,vert2,tria2] = bounds2mesh( boundsNew, hmax, grad_limit, opt );
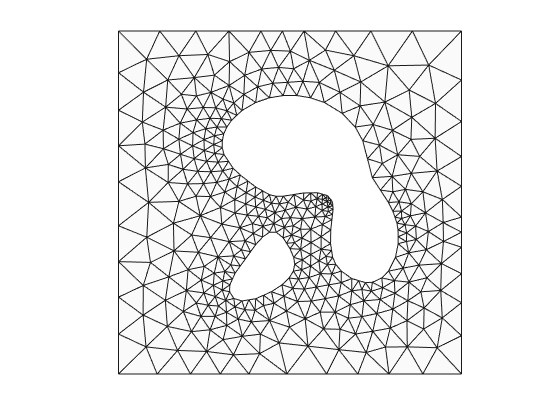
plotMeshes(vert,tria,tnum);
We could remove the mesh in the hole if we don't want it.
hmax = 500;
grad_limit = 0.25;
opt = [];
opt.disp = inf;     % silence verbosity

[vert,tria,tnum,vert2,tria2] = bounds2mesh( boundsNew(1), hmax, grad_limit, opt );
plotMeshes(vert,tria,tnum);
Create matlab pde model object
% linear model
model_linear = createpde();
geometryFromMesh( model_linear, vert', tria', tnum' );

% qudratic model
model_quad = createpde();
geometryFromMesh( model_quad, vert2', tria2', tnum' );
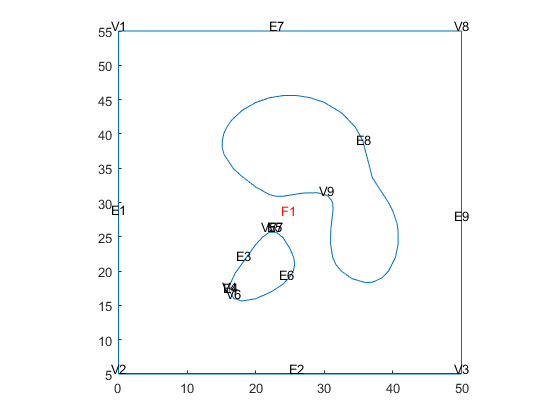
Show geometry
pdegplot(model_quad, 'EdgeLabels','on','VertexLabels','on', 'FaceLabels','on' )
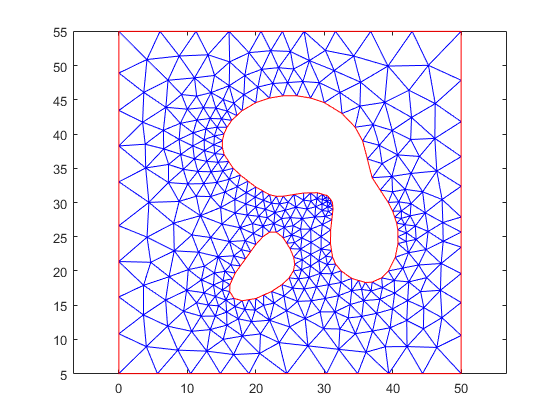
Show mesh
pdemesh( model_quad )
clear all
Example 2
Define Z, interested level, and outer boundary
n = -1:0.1:1;
Z = peaks(n);   % Z is a 21-by-21 matrix containing the height values of
                % the surface with respect to the x-y plane.

level = 1.5;    % interested level

% outer boundary
xmin = 1;
xmax = 21;
ymin = 1;
ymax = 21;
Plot surface
surf(Z);
view( -45 , 64 )
Plot contour
contour(Z, [level,level]);
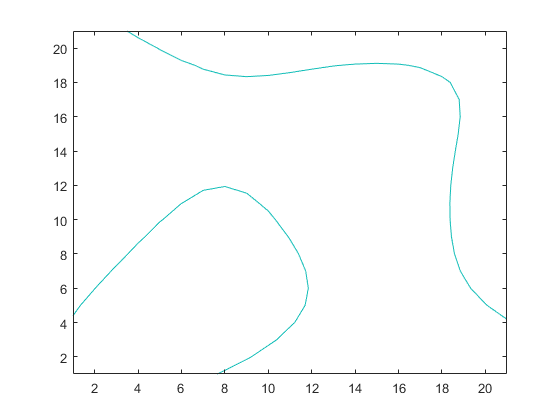
Store vertices in countour
% add (-inf) padding to Z
Z2 = padarray(Z,[1 1],-inf,'both');

C = contourc(Z2, [level,level]);

contourCell = {};   % a cell array for vertices in countours
k = 1;              % current column in C

while k < size(C,2)
    nv = C(2,k);           % number of vertices
    idx  = k+1 : k+nv;     % columns that hold the vertices
    xy = C(1:2,idx)';      % nv-by-2 array
    contourCell{end+1} = xy -1 ;    % -1 is used to removed padding

    k = k + nv + 1;       % jump to next header
end
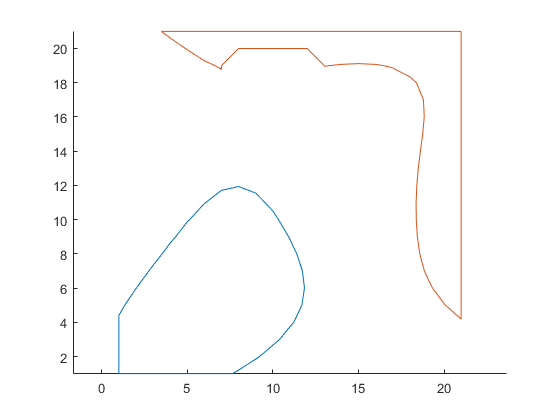
Plot contourCell
figure
hold on; axis equal
for i = 1: length(contourCell)
    plot( contourCell{i}(:,1), contourCell{i}(:,2) )
end
hold off
Convert contourCell to polyshape object
x_temp = [];
y_temp = [];

for i = 1: length(contourCell)
    x_temp = [ x_temp; NaN; contourCell{i}(:,1) ];
    y_temp = [ y_temp; NaN; contourCell{i}(:,2) ];
end

psIn = polyshape( x_temp, y_temp  );
Warning: Polyshape has duplicate vertices, intersections, or other
inconsistencies that may produce inaccurate or unexpected results. Input data
has been modified to create a well-defined polyshape.
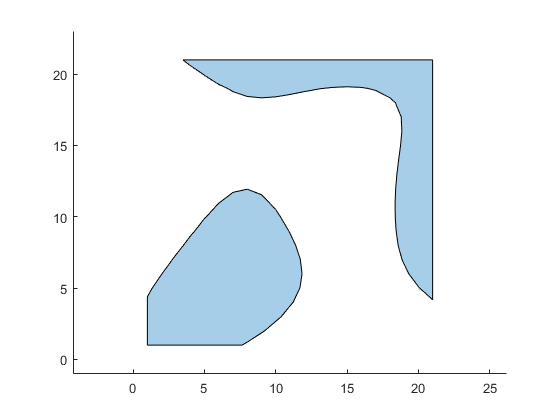
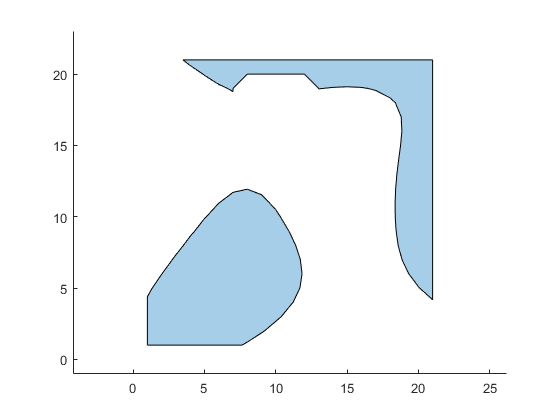
Plot polyshape object
plot(psIn);
axis equal
Create polyshape for outer boundary
vertex = [xmin ymin; xmax ymin; xmax ymax; xmin ymax; xmin ymin];
psOB = polyshape(vertex);   % polyshape for outer boundary
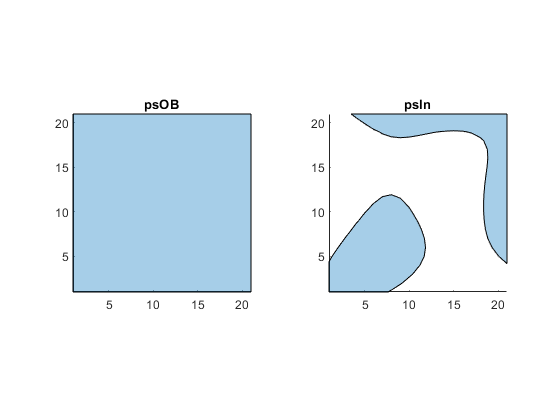
Plot
figure;
tiledlayout('flow')

nexttile
plot(psOB);
axis equal
title('psOB')
xlim([xmin xmax])
ylim([ymin ymax])

nexttile
plot(psIn);
axis equal
title('psIn')
xlim([xmin xmax])
ylim([ymin ymax])
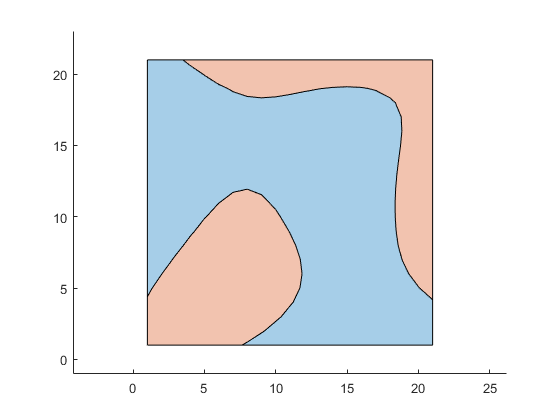
Boolean operation
psOB = subtract(psOB, psIn);
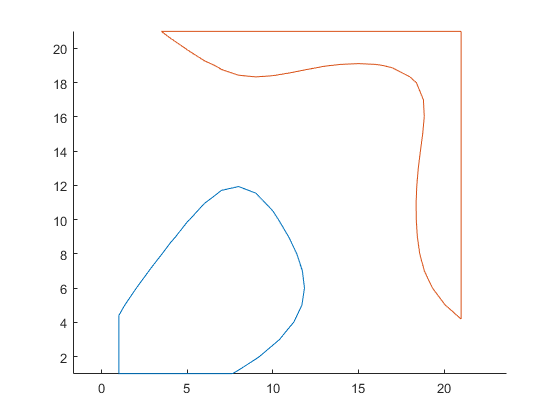
Plot
figure
hold on; axis equal
plot(psOB);
plot(psIn);
hold off
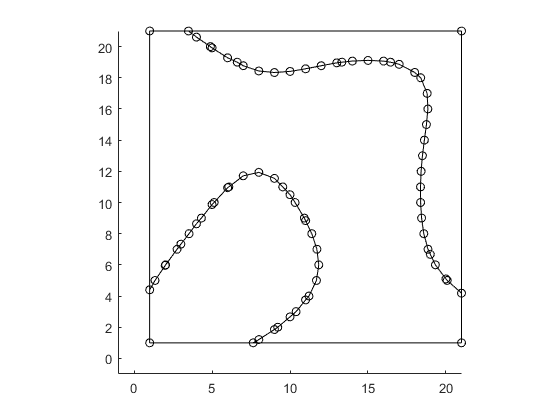
Convert to a nested cell array of polygons
psCell = {psOB; psIn};              % a cell array of polyshape
bounds = polyshape2bound(psCell);   % a nested cell array of polygons
tol_intersect = 1e-6;
bounds = addIntersectPnts( bounds, tol_intersect );

% plot polygons and show all vertices
plotBounds(bounds,false,'ko-')
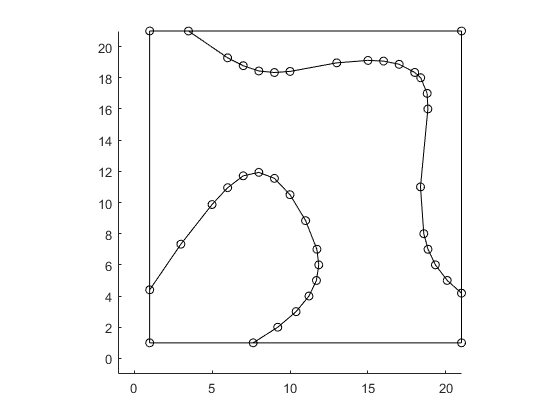
Reduce the number of vertices
boundsNew = getCtrlPnts( bounds, false );

tolerance = 0.07;  % For polyline simplification
                   % This value will affect the final mesh size.
                   % Increase tolerance, the min mesh size will increase.
boundsNew = simplifyBounds( boundsNew, tolerance );

% show all vertices
plotBounds(boundsNew,false,'ko-')
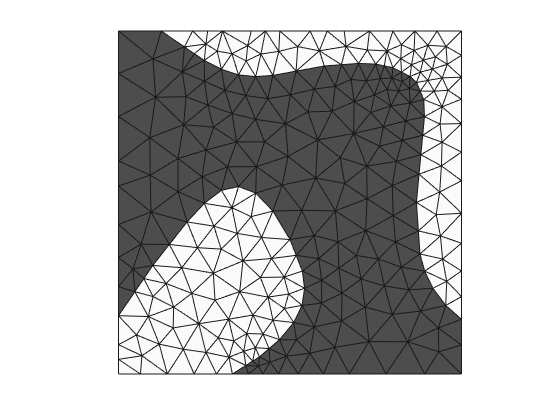
Generate mesh
hmax = 500;
grad_limit = 0.25;
opt = [];
opt.disp = inf;     % silence verbosity

[vert,tria,tnum,vert2,tria2] = bounds2mesh( boundsNew, hmax, grad_limit, opt );
plotMeshes(vert,tria,tnum);
Create matlab pde model object
% linear model
model_linear = createpde();
geometryFromMesh( model_linear, vert', tria', tnum' );

% qudratic model
model_quad = createpde();
geometryFromMesh( model_quad, vert2', tria2', tnum' );
Show geometry
pdegplot(model_quad, 'EdgeLabels','on','VertexLabels','on', 'FaceLabels','on' )
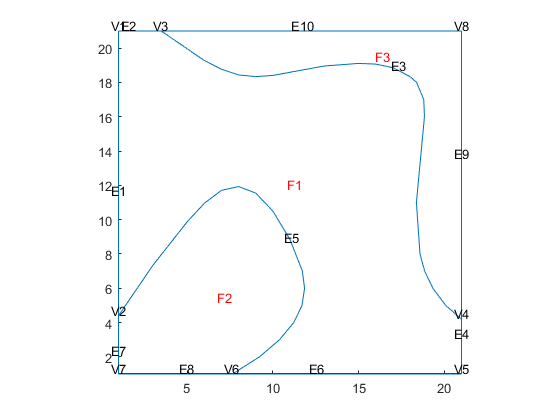
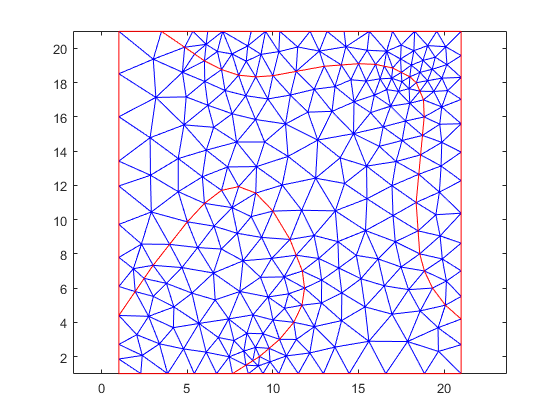
Show mesh
pdemesh( model_quad )
clear all
Example 3
Define Z, interested level, and outer boundary
n = -1:0.1:1;
Z = peaks(n);   % Z is a 21-by-21 matrix containing the height values of
                % the surface with respect to the x-y plane.

level = 1.5;    % interested level

% outer boundary
xmin = 1;
ymin = 1;
xmax = 21;
ymax = 21;

% Define hole
col_min = 8;      % column index
col_max = 12;
row_min = 14;     % row index
row_max = 19;
Z( row_min:row_max , col_min:col_max ) = -inf;
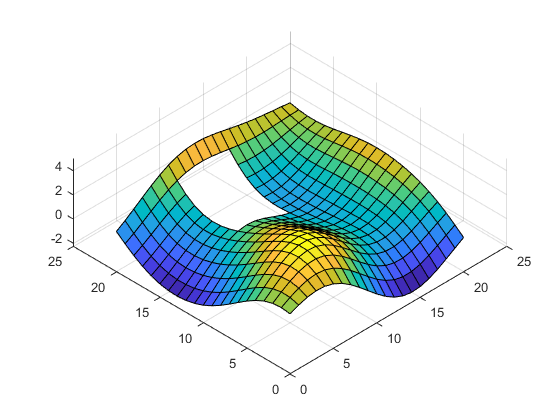
Plot surface
surf(Z)
view( -45 , 64 )
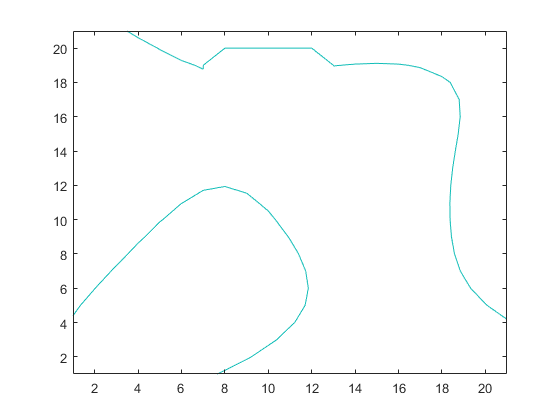
Plot contour
contour(Z, [level,level]);
Store vertices in countour
% add (-inf) padding to Z
Z2 = padarray(Z,[1 1],-inf,'both');

C = contourc(Z2, [level,level]);

contourCell = {};   % a cell array for vertices in countours
k = 1;              % current column in C

while k < size(C,2)
    nv = C(2,k);           % number of vertices
    idx  = k+1 : k+nv;     % columns that hold the vertices
    xy = C(1:2,idx)';      % nv-by-2 array
    contourCell{end+1} = xy -1 ;    % -1 is used to removed padding

    k = k + nv + 1;       % jump to next header
end
Plot contourCell
figure
hold on; axis equal
for i = 1: length(contourCell)
    plot( contourCell{i}(:,1), contourCell{i}(:,2) )
end
hold off
Convert contourCell to polyshape object
x_temp = [];
y_temp = [];

for i = 1: length(contourCell)
    x_temp = [ x_temp; NaN; contourCell{i}(:,1) ];
    y_temp = [ y_temp; NaN; contourCell{i}(:,2) ];
end

psIn = polyshape( x_temp, y_temp  );
Warning: Polyshape has duplicate vertices, intersections, or other
inconsistencies that may produce inaccurate or unexpected results. Input data
has been modified to create a well-defined polyshape.
Plot polyshape object
plot(psIn);
axis equal
Create polyshape for outer boundary and hole
vertex = [xmin ymin; xmax ymin; xmax ymax; xmin ymax; xmin ymin];
psOB = polyshape(vertex);   % polyshape for outer boundary

hxmin = col_min -1;
hxmax = col_max +1;
hymin = row_min -1;
hymax = row_max +1;
vertex2 = [hxmin hymin; hxmax hymin; hxmax hymax; hxmin hymax; hxmin hymin];
psHole = polyshape(vertex2);   % polyshape for hole
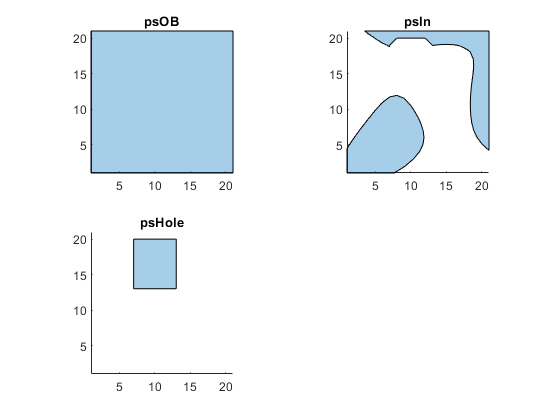
Plot
figure;
tiledlayout('flow')

nexttile
plot(psOB);
axis equal
title('psOB')
xlim([xmin xmax])
ylim([ymin ymax])

nexttile
plot(psIn);
axis equal
title('psIn')
xlim([xmin xmax])
ylim([ymin ymax])

nexttile
plot(psHole);
axis equal
title('psHole')
xlim([xmin xmax])
ylim([ymin ymax])
Boolean operation to remove overlaps
psOB = subtract(psOB, psIn);
psOB = subtract(psOB, psHole);

psIn = subtract(psIn, psHole);
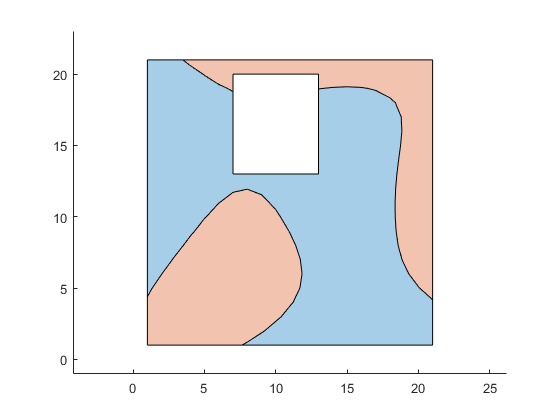
Plot
figure
hold on; axis equal
plot(psOB);
plot(psIn);
hold off
Convert to a nested cell array of polygons
psCell = {psOB; psIn}; % a cell array of polyshape
bounds = polyshape2bound(psCell); % a nested cell array of polygons
tol_intersect = 1e-6;
bounds = addIntersectPnts( bounds, tol_intersect );
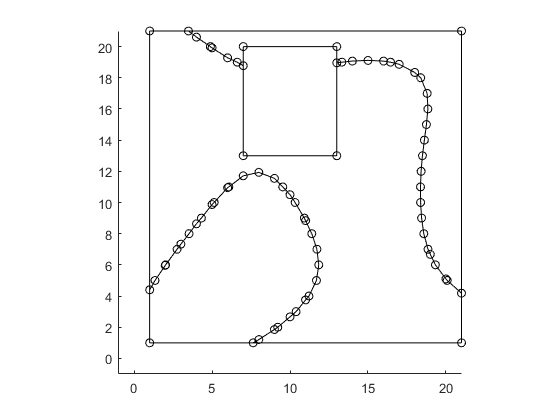
% plot polygons and show all vertices
plotBounds(bounds,false,'ko-')
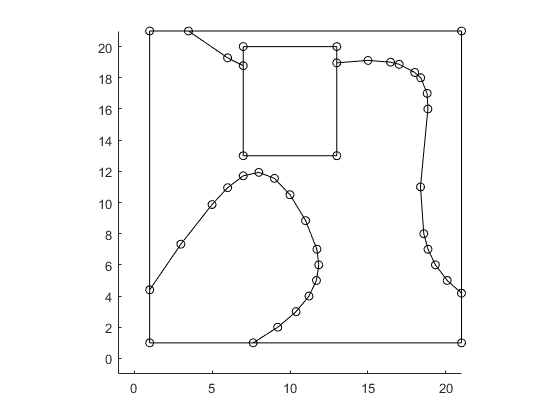
Reduce the number of vertices
boundsNew = getCtrlPnts( bounds, false );

tolerance = 0.07;  % For polyline simplification
                   % This value will affect the final mesh size.
                   % Increase tolerance, the min mesh size will increase.
boundsNew = simplifyBounds( boundsNew, tolerance );

% show all vertices
plotBounds(boundsNew,false,'ko-')
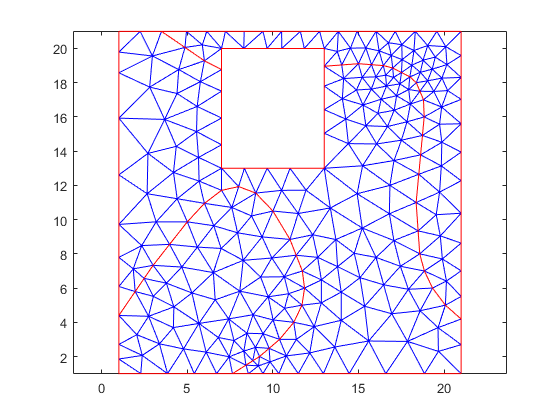
Generate mesh
hmax = 500;
grad_limit = 0.25;
opt = [];
opt.disp = inf; % silence verbosity
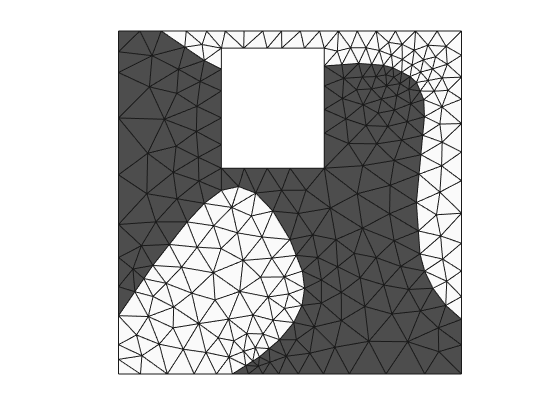
[vert,tria,tnum,vert2,tria2] = bounds2mesh( boundsNew, hmax, grad_limit, opt );
plotMeshes(vert,tria,tnum);
Create matlab pde model object
% linear model
model_linear = createpde();
geometryFromMesh( model_linear, vert', tria', tnum' );

% qudratic model
model_quad = createpde();
geometryFromMesh( model_quad, vert2', tria2', tnum' );
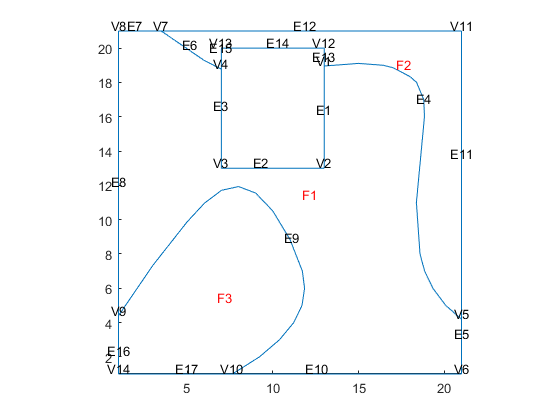
Show geometry
pdegplot(model_quad, 'EdgeLabels','on','VertexLabels','on', 'FaceLabels','on' )
Show mesh
pdemesh( model_quad )
end